

I've tested my grip strength twice in the last year, and both times, the numbers told me more than I expected.
This article breaks down the grip strength chart, what it measures, how to read it, and what your score actually means for your health.
You'll find age and sex-based norms, how to compare your score, health risks from low grip strength, and simple ways to improve.
We've pulled from peer-reviewed research and clinical norms to give you accurate, useful information. I've spent time studying this topic closely, and I want to make it easy for you.
If you've ever wondered where you stand, this guide gives you a clear answer.
Understanding the Grip Strength Chart
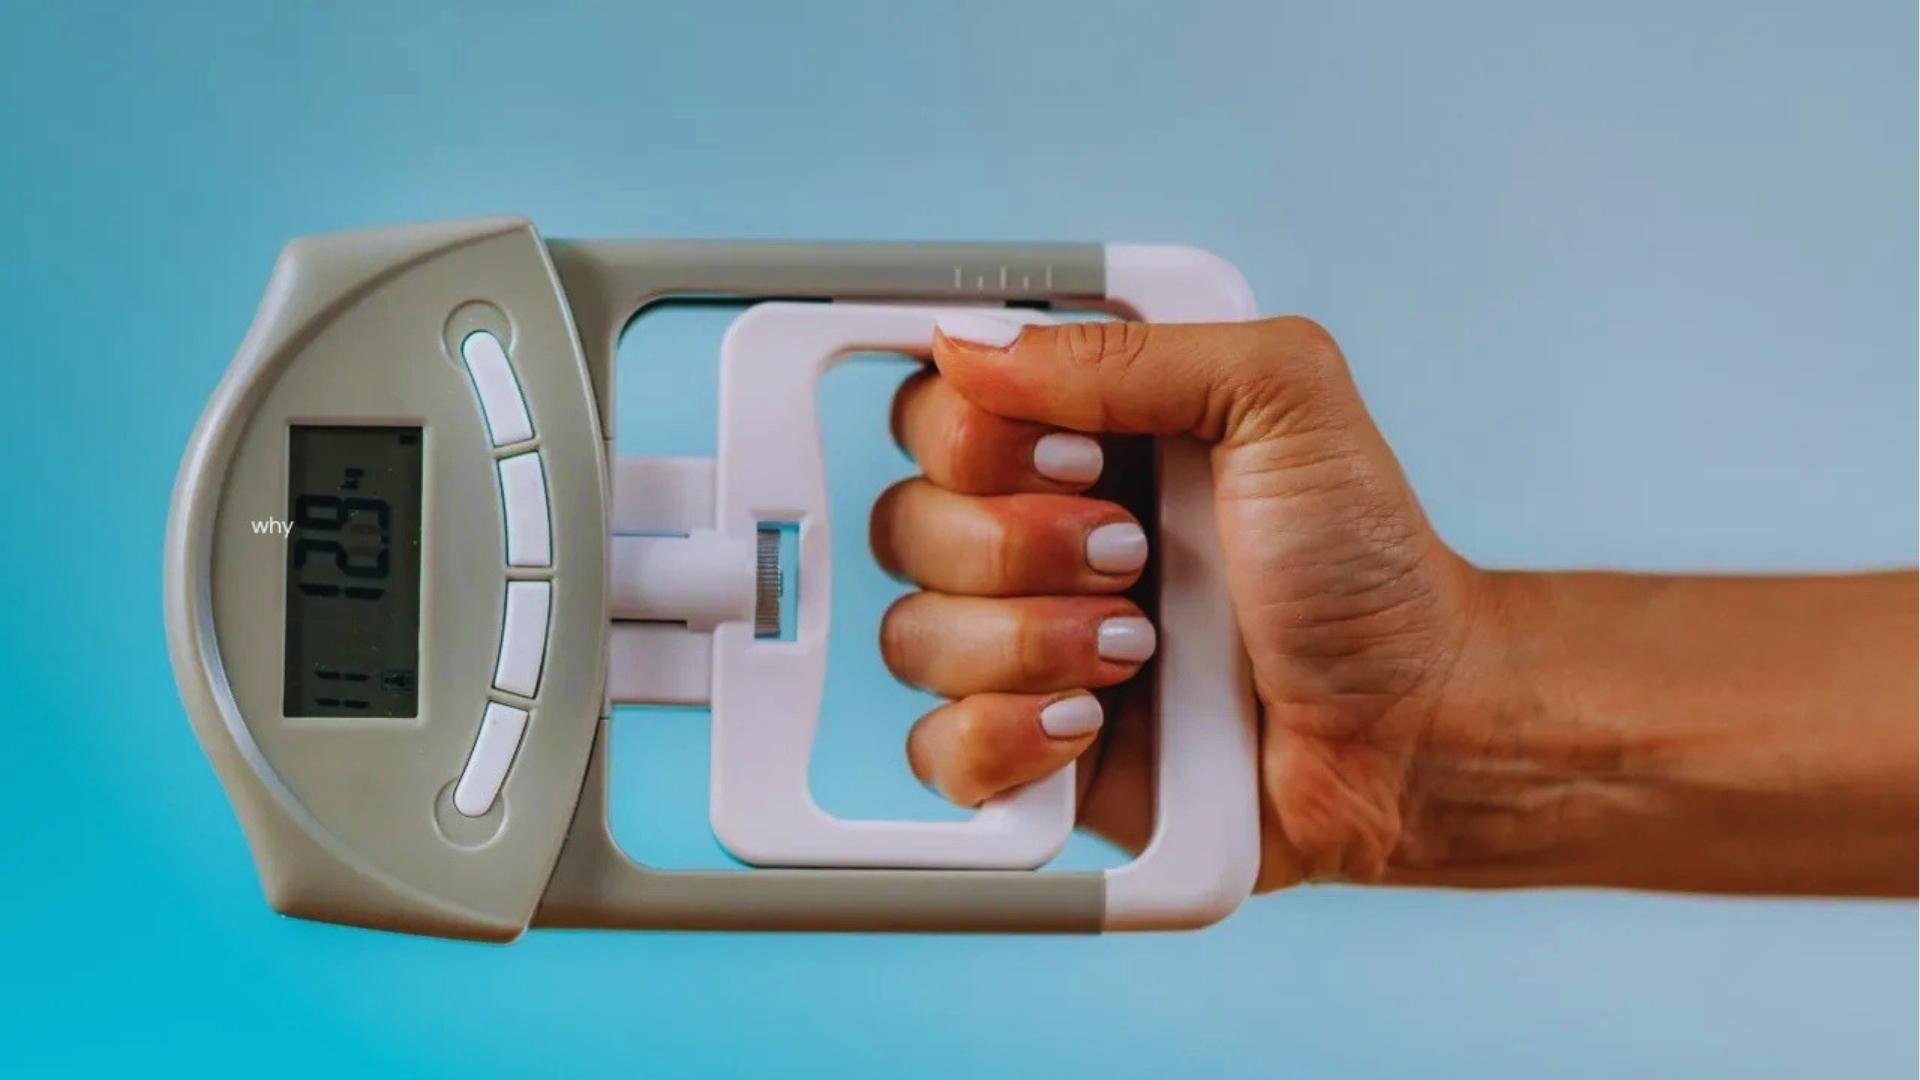
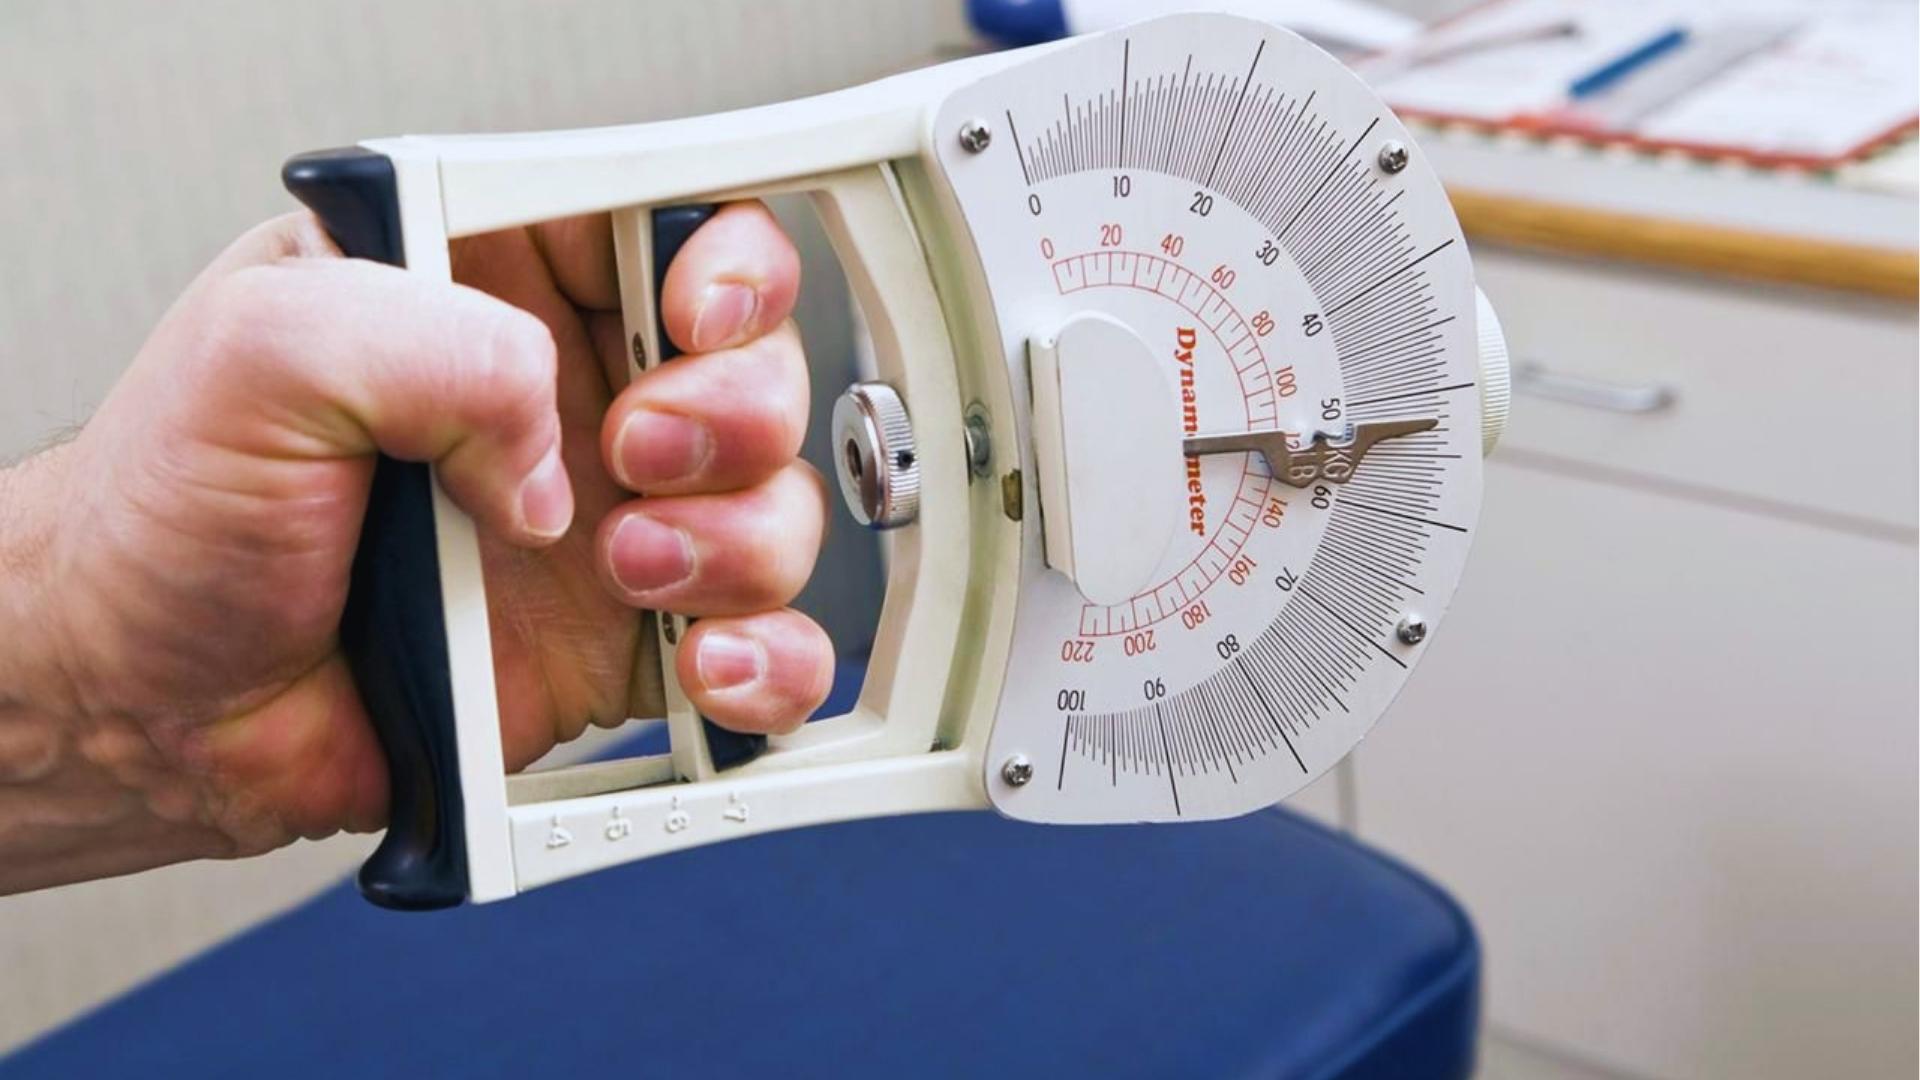
A grip strength chart shows how much force your hand can produce, measured in kilograms or pounds using a tool called a dynamometer.
It groups scores by age and sex, giving you a fair comparison instead of one number for everyone.
Research links grip strength to overall muscle health, heart health, and longevity so it measures more than just hand strength.
Men and women differ in muscle mass and hormone levels, which is why separate norms exist.
Most charts use three categories: below average, average, and above average. Your score is always compared to people in your age and sex group.
Grip Strength by Age Peak Years and Decline

Grip strength follows a predictable pattern across life, peaking early and declining gradually after middle age.
When Grip Strength Peaks (20s-30s)
Most people hit their highest grip strength between ages 25 and 35. During this time, muscle mass, nerve function, and hormones like testosterone are all at their strongest.
For men, peak averages often fall between 45-55 kg. For women, between 25-35 kg. These numbers vary by body size and activity level.
Rate of Decline After Age 40
After 40, grip strength drops by roughly 1-3% per year. This feels slow, but it adds up fast. By age 60, many people have lost 20-30% of their peak strength without realizing it.
This decline speeds up after 65. Inactivity, poor nutrition, and chronic illness make it worse.
How Aging Impacts Muscle and Neural Strength
Aging reduces muscle fiber count and nerve signal speed. Both affect grip directly. The brain sends slower signals to the hand, and fewer muscle fibers respond.
This is called age-related muscle loss, or sarcopenia. Grip strength is one of the first signs of this condition.
How to Compare Your Grip Strength to the Chart

Comparing your score to the chart takes just a few steps and gives you a clear picture of where you stand.
Step-by-Step Method to Find Your Category
- Measure your grip using a hand dynamometer
- Record your best score from three attempts
- Find your age group on the chart
- Find your sex column
- Match your score to the category shown
Most charts list scores in kg. If yours is in lbs, divide by 2.2 to convert.
Understanding Where You Rank
Once you find your score on the chart, you'll fall into one of these groups:
- Below average: lower than most in your age group
- Average: within the normal range
- Above average: stronger than most peers
Each category carries different health implications.
What Small Differences in Scores Actually Mean
A 2-3 kg difference between you and the average is not a crisis. Charts show ranges, not exact targets. However, if you score 10 kg or more below average, that is worth addressing.
Track changes over time. A drop of 5 kg or more over one year is more important than where you start.
Dominant vs Non-Dominant Hand Comparison
Your dominant hand is usually 10% stronger. If the gap is much larger, it could point to injury or nerve issues on one side.
Always test both hands and record both scores. Some charts offer separate norms for dominant and non-dominant hands.
Average Grip Strength for Men and Women

Knowing the population averages by sex and age helps you set realistic strength goals and spot concerning gaps.
Men's Grip Strength Norms Across Age Groups
Grip strength norms for men vary by age group.
| Age Group | Below Average | Average | Above Average |
| 20–29 | Below 40 kg | 40–55 kg | Above 55 kg |
| 30–39 | Below 38 kg | 38–53 kg | Above 53 kg |
| 40–49 | Below 35 kg | 35–50 kg | Above 50 kg |
| 50–59 | Below 30 kg | 30–45 kg | Above 45 kg |
| 60–69 | Below 25 kg | 25–40 kg | Above 40 kg |
Women's Grip Strength Norms Across Age Groups
Grip strength norms for women vary by age group.
| Age Group | Below Average | Average | Above Average |
| 20–29 | Below 22 kg | 22–33 kg | Above 33 kg |
| 30–39 | Below 20 kg | 20–32 kg | Above 32 kg |
| 40–49 | Below 18 kg | 18–30 kg | Above 30 kg |
| 50–59 | Below 16 kg | 16–27 kg | Above 27 kg |
| 60–69 | Below 13 kg | 13–24 kg | Above 24 kg |
Comparing Your Score to Population Averages
These norms come from large population studies. They are not perfect for every body type, but they are reliable benchmarks.
If you score in the average range, focus on maintaining. If you score below, focus on improving.
What Your Grip Strength Score Means
Your score is more than a number. It reflects your muscle health, aging rate, and risk for future physical decline.
Below Average vs Average vs Above Average
Below average does not mean something is wrong right away. But it is a signal worth taking seriously. It often points to low overall muscle mass.
Average means your strength is in line with your peers. Keep it there through regular activity.
Above average is a strong sign of good muscle health. People in this range tend to have better long-term outcomes.
Health Risks Linked to Low Grip Strength
Studies show low grip strength is connected to
- Higher risk of heart disease
- Greater chance of falls and fractures
- Slower recovery from illness
- Shorter life expectancy in older adults
Grip strength is used in hospitals as a quick test for overall physical health.
Sarcopenia and Early Warning Signs
Sarcopenia is the medical term for age-related muscle loss. Low grip strength is one of its earliest signs.
Watch for these early signals
- Difficulty opening jars
- Dropping objects more often
- Feeling tired after light tasks
- Slower walking speed
Catching it early makes it easier to reverse through training and nutrition.
Tips to Measure and Improve Grip Strength
You can measure and build grip strength at home with simple tools and a short daily routine.
- Use a hand dynamometer, stand straight, elbow at 90 degrees, squeeze for 3 seconds, record your best score.
- Avoid bending your wrist, using momentum, or skipping rest time between attempts for accurate results.
- Do stress ball squeezes, towel wringing, dead hangs, and finger extensions at least 5 days weekly.
- Keep sessions under 5 minutes and stay consistent rather than training hard only once in a while.
- Most people gain 3–5 kg within 8 weeks of regular, focused grip strength training.
- Progress slows over time, so add resistance or new exercises to keep seeing steady improvement.
Conclusion
Looking at a grip strength chart for the first time can feel surprising. I know it was for me. But those numbers are genuinely useful. They tell you where you are and where you need to go.
If your score is lower than you hoped, that is okay. Small, consistent effort makes a real difference. Start with 5 minutes a day.
Did this help you understand your grip strength chart results? Leave a comment below or share this with someone who might need it.
Frequently Asked Questions
What is a good grip strength score for my age?
A good score falls within the average range for your age group and sex. For men aged 40–49, around 35–50 kg is normal. For women in the same age group, 18–30 kg is typical.
Can I improve grip strength after age 60?
Yes. Research shows that people over 60 can improve grip strength through regular resistance training. Even light daily exercises show measurable gains within 6–8 weeks.
How often should I test my grip strength?
Testing every 4–6 weeks gives useful data without obsessing over daily changes. Use the same hand position and tool each time for accurate comparison.
Is grip strength a sign of heart health?
Studies link low grip strength to higher cardiovascular risk. It is not a direct measure of heart health, but it reflects overall muscle and physical condition, which affects heart health over time.
What causes sudden grip strength loss?
Sudden loss can point to nerve compression, injury, stroke, or neurological conditions. If your grip drops sharply in a short time, speak with a doctor rather than assuming it is just aging.


